Plan Management Guide
User Guide
SaaSMap
Introduction
The Plan feature in SaaSMap provides project teams with a structured way to organize, schedule, and track project work from start to finish. Within a project, the Plan tab gives users a centralized workspace to build a task hierarchy, assign owners, set timelines, monitor progress, and generate project phases — all in one place.
Plans can be created in three ways: tasks can be added one at a time manually, imported from a pre-filled Excel template, or generated automatically by AI from a Statement of Work (SOW) document. Once a plan exists, an AI assistant can also analyze the plan and propose a set of project Phases, which flow into the Phase tab.
This guide covers all Plan capabilities in the order a typical user would encounter them, from setting up the first task to advanced features like bulk editing, date shifting, and AI phase generation.
Accessing the Plan Tab
To access the Plan feature, open a project and click on the “Plan” tab.
The tab is available alongside other project tabs such as Phase, Backlog, and Test Cases. Access to Plan and each of its capabilities is governed by your project role. If you do not have any Plan privileges, the tab will not be visible.
Note: Availability of AI features within Plan (Create Plan from SOW, Create Phases from Plan) also depends on your organisation’s subscription and whether AI is enabled for the tenant.
One Plan per Project
SaaSMap enforces a single root plan per project. This means:
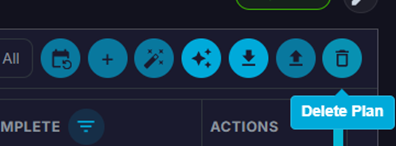
- Once any top-level task exists, the “+” (Add), Import Excel, and Create Plan from SOW options are disabled until the current plan is deleted.
- All work is organized as a hierarchy under that one root task, with up to four levels of nesting.
- To start over, use the Delete Plan option in the toolbar, which removes the entire plan and re-enables the creation options.
Plan Views
The Plan tab offers two view modes, toggled from the toolbar. Both views share the same underlying task data; switching between them does not change or reset anything.
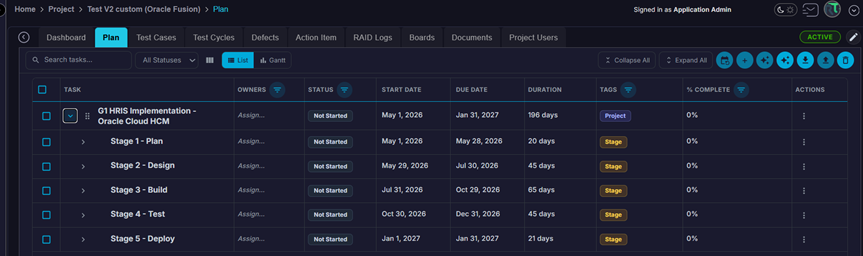
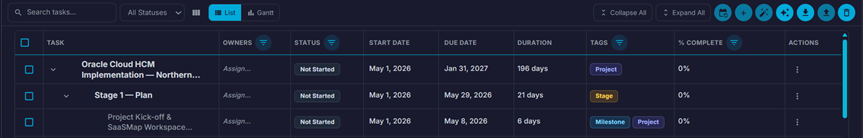
List View
List view displays plan tasks as an expandable tree table. Each row represents one task; parent tasks can be expanded to reveal their subtasks.
The columns shown by default are:
| Column | What it shows |
| Task | The task title. Expand/collapse icons appear on rows that have subtasks. |
| Owners | Project members assigned to the task, shown as coloured initials. |
| Status | Current status shown as a colour-coded badge. |
| Start Date | Planned start date for the task. |
| Due Date | Planned end date for the task. |
| Duration | Working days between start and due, excluding weekends. Calculated automatically; not directly editable. |
| Tags | Any labels or tags attached to the task. |
| % Complete | Progress percentage (0–100). For parent tasks this is a roll-up average of children. |
| Actions | Per-row action menu (⋮). |
Tip: Use the Columns button in the toolbar to show or hide individual columns. The Task column cannot be hidden.
Gantt View
Gantt view splits the screen into two panes. The left pane shows the task tree (task name, status indicator, owner avatars); the right pane shows a scrollable timeline with bars representing each task’s duration.
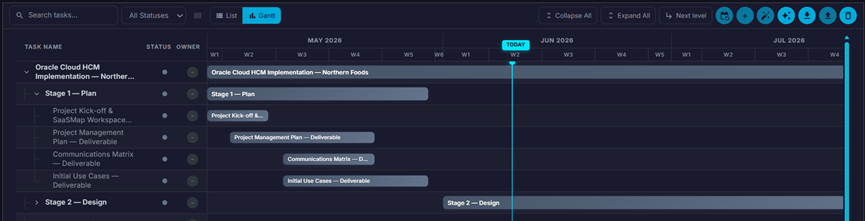
- The timeline header shows months at the top and weeks below. Click a week to expand it to individual days.
- A vertical “Today” marker highlights the current date.
- Each bar is coloured by the task’s status and shows a filled portion representing % complete.
- Hover over a bar to see a tooltip with the task title, date range, and progress.
- Click a bar or a task name to open the Task Details modal (if you have view permission).
- The “Next level” toolbar button expands one further level of collapsed tasks in the chart.
Note: Gantt bars cannot be dragged to change dates. Use inline editing or the Task Details modal to update dates.
Creating Plan Tasks
Tasks can be created in three ways: manually one at a time, by importing an Excel file, or by letting AI generate the plan from a Statement of Work document.
Manual Creation
Click the “+” button in the toolbar to open the Add Task form.
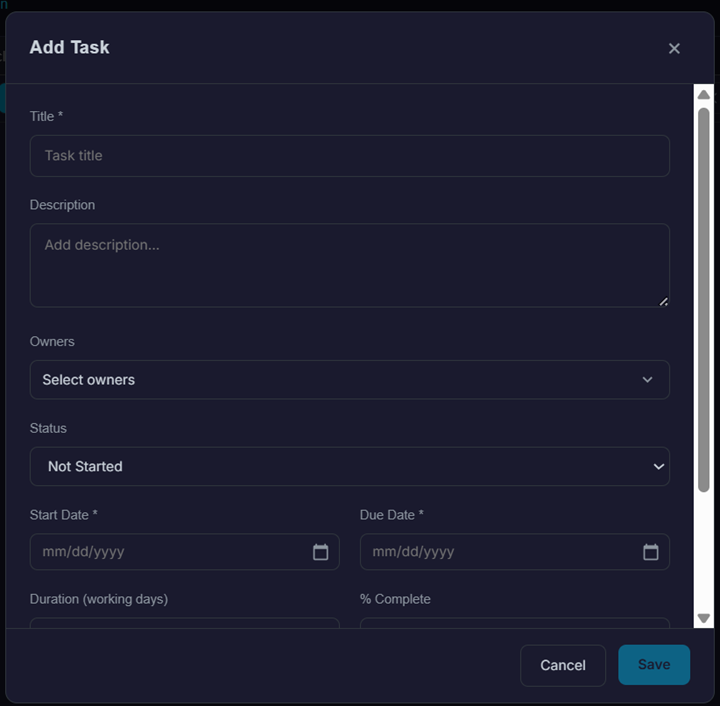
The following fields are available:
| Field | Required | Notes |
| Title | Yes | Short descriptive name for the task. |
| Description | No | Additional context or detail for the task. |
| Owners | No | One or more project members. Search by name or email. |
| Status | No | Defaults to Not Started. See status list in the Field Reference section. |
| Start Date | Yes | Planned start date. |
| Due Date | Yes | Must be on or after the start date. |
| Tags | No | Comma-separated labels for grouping and filtering. |
| % Complete | No | Defaults to 0. Setting 100 automatically marks status as Completed. |
Click Save to create the task. Duration is calculated automatically from the dates.
Adding Subtasks
To add a child task under an existing task, click the ⋮ (Actions) menu on any row and choose “Add subtask”. The same form appears with the parent task pre-set. Tasks can be nested up to four levels deep.
Import from Excel
If you have a pre-prepared list of tasks, you can import them in bulk using an Excel spreadsheet:
- Click the Upload (import) icon in the toolbar.
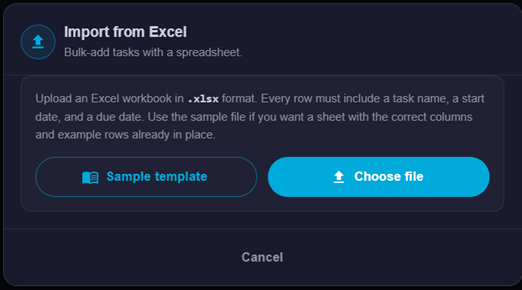
- In the Import dialog, click “Download Sample File” to get a template with the correct columns and example data.
- Fill in the template: at minimum provide Task name, Start Date, and Due Date for each row. The Level column controls nesting depth (1 = root, 2 = child of 1, etc.).
- Upload the completed file. A progress bar shows the import status.
- After import, a summary dialog reports how many rows were created and lists any errors.
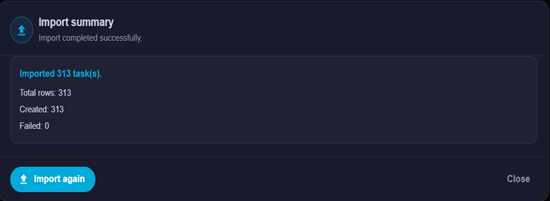
- If any rows fail validation, the entire import is rolled back so you can fix and retry.
Note: Import is only available when no plan exists yet for the project.
Create Plan from SOW (AI)
SaaSMap can automatically generate a complete plan from a Statement of Work document using AI. This is the fastest way to build an initial project plan when you have a signed or draft SOW.
Click the first ✨ (sparkle) button in the toolbar to open the Create Plan from SOW dialog. The workflow has the following steps:
- Step 1 — Upload SOW: Upload your SOW as a .txt, .pdf, or .docx file. The application reads the document on your device before sending it to the AI.
- Step 2 — Choose Detail Level: Select Balanced Detail (Coarse Grain) for higher-level grouped tasks, or High Detail (Fine Grain) for a more granular, execution-ready breakdown.
- Step 3 — Special Instructions (optional): Provide any additional context in plain language — for example, “Mark tasks before March 2025 as Completed” or “Group all testing tasks under a single Testing phase.” A microphone button is available for voice dictation if configured.
- Step 4 — Generate: Click Generate. An animated log stream shows what the AI is doing step by step.
The AI validates the generated plan before saving:
- If the SOW does not contain enough scheduling information (dates or durations), generation is stopped and you will be asked to add timeline details to the SOW or provide them via Special Instructions.
- If the SOW has durations, they are faithfully applied. If it would cause tasks to exceed the project end date, generation is blocked. The error message lists the specific tasks that exceed the boundary and advises you to either extend the project end date or adjust the timeline via Special Instructions.
- If validation passes, tasks are saved and the plan tree appears in the List and Gantt views.
Note: Create Plan from SOW is only available when no plan exists yet. Once tasks are present, this button is disabled.
Editing Tasks
Inline Editing (List View)
In list view, most fields can be edited directly in the table without opening a separate form. Click on an editable cell to activate it:
- Title — click the task name to type a new title.
- Owners — click the owners cell to open a multi-select dropdown; search by name or email.
- Status — click the status badge on a leaf task to pick a new status from the dropdown.
- Start Date / Due Date — click a date to open a date picker.
- Tags — click the tags cell to enter or edit comma-separated tags.
- % Complete — click the percentage on a leaf task to enter a new value.
Note: Status and % Complete cannot be edited directly on parent tasks. They are automatically calculated from the children.
Changes are saved automatically when you press Enter or click away from the cell.
Task Details Modal
For a full editing experience, open the Task Details modal by clicking the task title or choosing “View details” from the ⋮ menu. The modal contains four tabs:
| Tab | Contents |
| Details | Full form with all task fields: title, description, owners, status, start date, due date, duration (read-only), tags, and % complete. Click Save to apply changes. |
| Comments | Add comments using a rich-text editor. Check the Internal box to mark a comment as internal-only. Edit or delete your own comments. |
| Attachments | Upload, download, or delete files attached to the task. |
| Activity | A chronological audit log of all changes: task creation, field updates, comments, and attachment events. |
Tip: Tab visibility depends on your project role privileges. If you cannot see a tab, contact your project administrator.
Row Action Menu
Click the ⋮ icon at the end of any row to see the following options:
| Action | Description |
| View details | Open the Task Details modal. |
| Add subtask | Create a child task under this one (up to four levels deep). |
| Make parent | Move this task to the top level of the plan (available for non-root tasks only). |
| Delete | Delete this task and all its subtasks after a confirmation prompt. |
Bulk Editing
To update multiple tasks at once, check the checkbox on one or more rows. A bulk update bar appears below the toolbar.
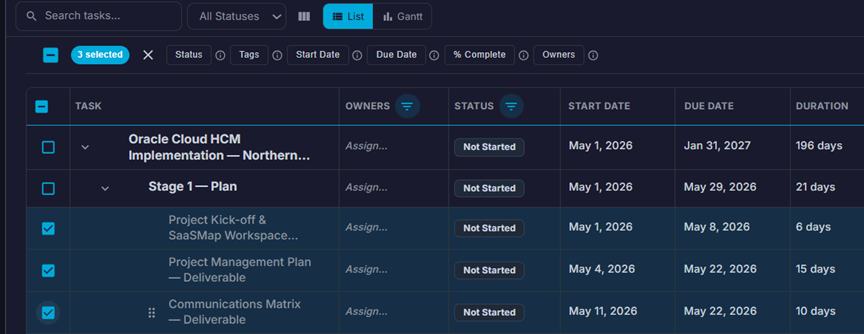
Select a field from the bar and provide a new value; the change is applied to all selected tasks in one action.
| Field | Notes |
| Status | Applied only to leaf tasks in the selection. Parent task status is calculated automatically. |
| Tags | Replaces the tags on all selected tasks. |
| Start Date | Updated for all selected tasks that have edit permission and valid date constraints. |
| Due Date | Same rules as Start Date. |
| % Complete | Applied only to leaf tasks. |
| Owners | Replaces the owner list on all selected tasks. |
Tasks that cannot be updated (because they are parent tasks) are skipped, and a toast message summarises how many were updated and how many were skipped.
Tip: Use the checkbox in the column header to select all currently visible (filtered) rows at once.
Shifting Dates
The Shift Dates toolbar button (the circular arrow icon) lets you move the start and due dates of selected tasks forward or backward by a fixed number of calendar days without editing each task individually.
- Select one or more tasks using the checkboxes.
- Click the Shift Dates icon.
- Enter the number of days to shift (positive = forward, negative = backward). Quick presets are available: −1, −7, −14, −30, +1, +7, +14, +30.
- Click Apply. The system validates that the new dates remain within the project start and end dates.
After the operation, a summary dialog shows how many tasks were updated and how many were skipped (for example, because the shifted date would fall outside the project boundary or because you do not have edit permission on those tasks).
Reordering Tasks by Drag and Drop
In list view, tasks can be reordered using the drag handle (⋮⋮) on the left side of each row. Drag a task and drop it in a new position:
- Drop on the top half of a row — places the dragged task above the target row at the same level.
- Drop on the bottom half of a row — places the dragged task below the target row at the same level.
- Hold Shift and drop on the middle of a row — nests the dragged task inside the target as a child.
A hint bar appears during the drag to indicate where the task will land. The new order is saved immediately.
Note: Column headers can also be dragged left or right to reorder them. Column order is remembered per project.
Filtering and Searching
Use the toolbar and column-level controls to narrow down the task list:
| Control | Where | What it filters |
| Search box | Toolbar | Filters tasks by title, owner name, or tag. Parent rows are kept visible when any child matches. |
| All Statuses dropdown | Toolbar | Shows only tasks with the selected status. |
| Column filter (▼) | List view column headers | Fine-grained filter per column: Owners, Tags, Status, or % Complete with comparison operators (equals, greater than, less than). |
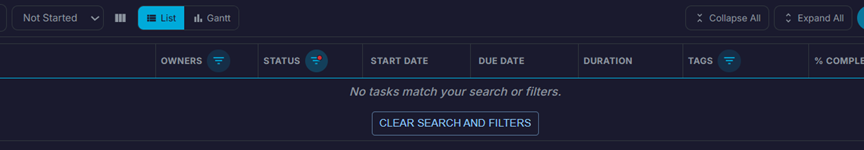
If filters produce no visible rows, a “Clear search and filters” button appears to reset everything at once.
Note: Column filters are available in List view only. Gantt view supports the toolbar search and status filter.
Exporting the Plan
Click the Download icon in the toolbar to export the entire plan as an Excel file (.xlsx). The file is named using the project identifier and contains all tasks in tree order with the following columns: Level, Task, Description, Owners, Status, Start Date, Due Date, Duration, Tags, % Complete, and Task ID.
AI — Create Phases from Plan
Once a plan exists, the ✨ (sparkle) button in the toolbar allows AI to analyse the plan and propose a set of project Phases.
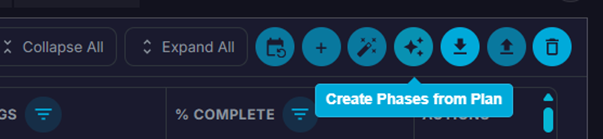
These phases are saved to the Phase tab and serve as the project’s milestone and sprint structure.
Prerequisites before using this feature:
- At least one plan task must exist in the project.
- No phases can already exist in the project. Once phases are created, re-generation is blocked until the existing phases are removed.
- AI must be enabled for your organisation’s subscription.
How it works:
- Click the ✨ button. The system validates that the plan is ready for phase generation.
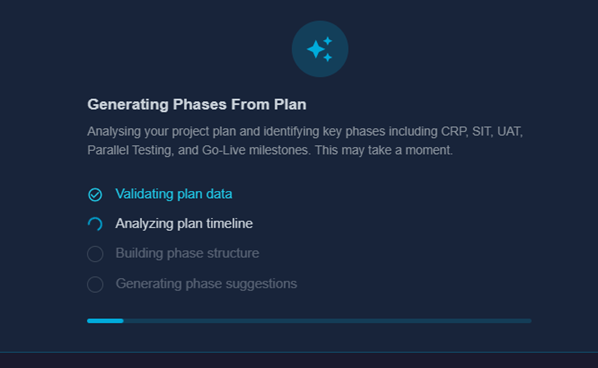
- An animated progress indicator shows steps: validating plan → analysing timeline → building phase structure.
- When complete, a preview table appears showing the proposed phases: Phase Name, Predecessor, Start Date, End Date, and Goal.
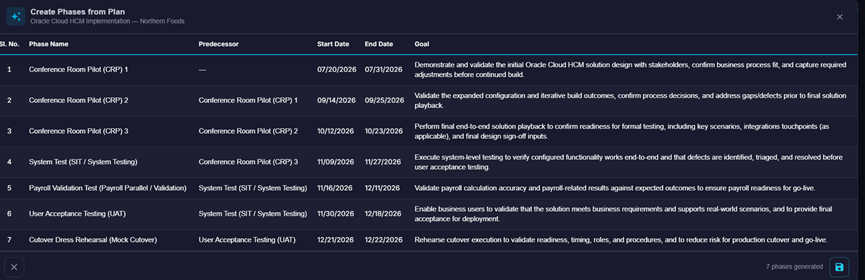
- Review the phases. If satisfied, click Save. The phases are created in the Phase tab and are immediately available there.
Note: Create Phases from Plan is a one-time action per project. Once phases have been generated and saved, the button will show a message indicating that phases already exist.
Collapsing and Expanding the Task Tree
Use the Collapse All and Expand All buttons in the toolbar to control the visibility of subtasks across the entire tree at once. You can also click the expand/collapse icon on individual rows to toggle just that branch.
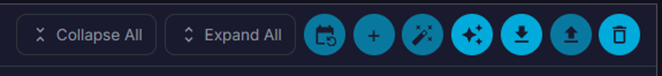
In Gantt view, use the Next Level button to expand one additional level of collapsed tasks at a time, which is useful for large plans where you want to reveal the hierarchy gradually.
Field Reference
Task Statuses
Each plan task can have one of the following statuses:
| Status | Meaning |
| Not Started | Work has not yet begun. Default status for new tasks. |
| In Progress | Work is actively underway. |
| Completed | All work is done. Automatically set when % Complete reaches 100. |
| Blocked | Work cannot proceed due to a dependency or impediment. |
| On Hold | Work has been intentionally paused. |
Status and % Complete are kept in sync for leaf tasks:
- Setting status to Completed automatically sets % Complete to 100.
- Setting status to Not Started automatically sets % Complete to 0.
- Setting % Complete to 100 automatically sets status to Completed.
- Setting % Complete to 0 automatically sets status to Not Started.
- Setting % Complete to any value between 1 and 99 automatically sets status to In Progress.
Note: Parent task status and % Complete are read-only; they are automatically calculated from the leaf tasks below them.
Duration
Duration is displayed in working days and is calculated automatically from the start and due dates. Weekends are excluded from the count. Duration cannot be edited directly; change the Start or Due date to adjust it.
Tags
Tags are free-text labels that can be added to any task. They are useful for grouping tasks by theme, workstream, or priority. Enter multiple tags separated by commas. Tags can be used as a filter in the toolbar and in column-level filters.
Relationship with the Phase Tab
The Plan tab and the Phase tab are separate but connected. The Plan tab is where you build and manage the project’s task hierarchy and timeline. The Phase tab (also called the Milestone tab) is where project phases, sprints, and requirements are managed.
The connection between them is the “Create Phases from Plan” AI feature. When you generate phases from the plan, AI reads the plan structure and timeline and creates a matching set of project phases in the Phase tab. This is a one-way operation: plan tasks inform the phases, but changes to phases do not flow back into the plan.